
 Weather
Key points
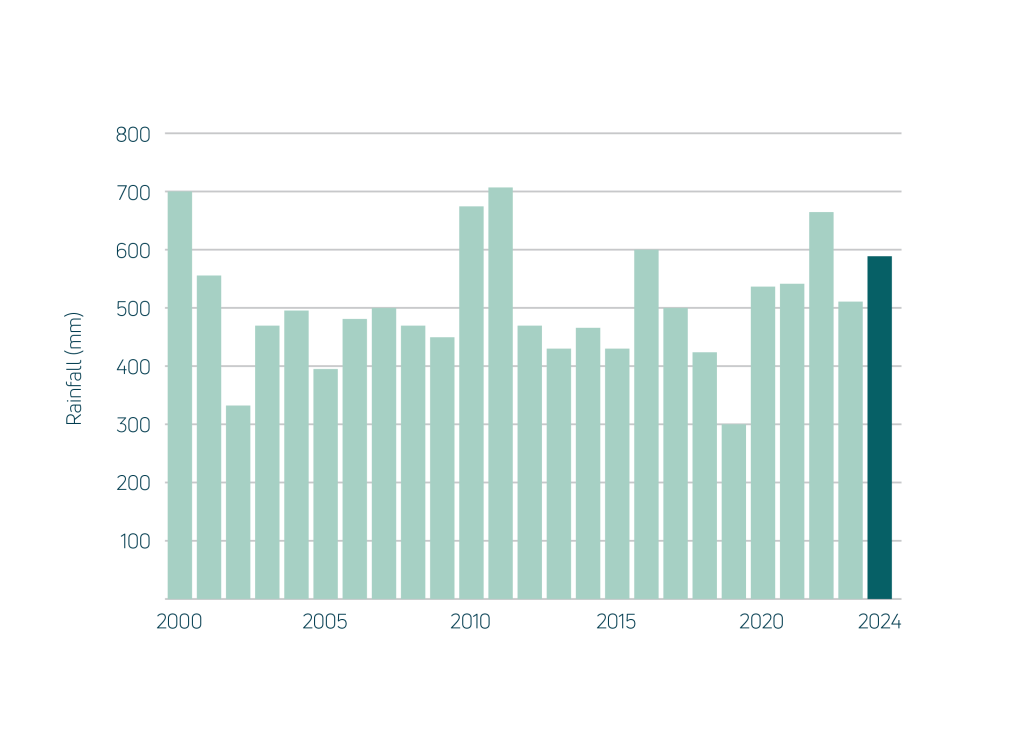
- Rainfall was above average, despite very dry conditions in South Australia.
National average rainfall was 592 mm and 18% higher than the 2000–2023 average. Rainfall was average across much of Australia except for the SA coast, which experienced the driest year since at least 2000, and parts of inland Northern Territory, which experienced the wettest.
Rainfall was also above average in other parts of northern Australia and below average along the south WA coast and southwestern Victoria. Nationally, rainfall was well above average in January and March and again in November and December, while April and May were relatively dry.
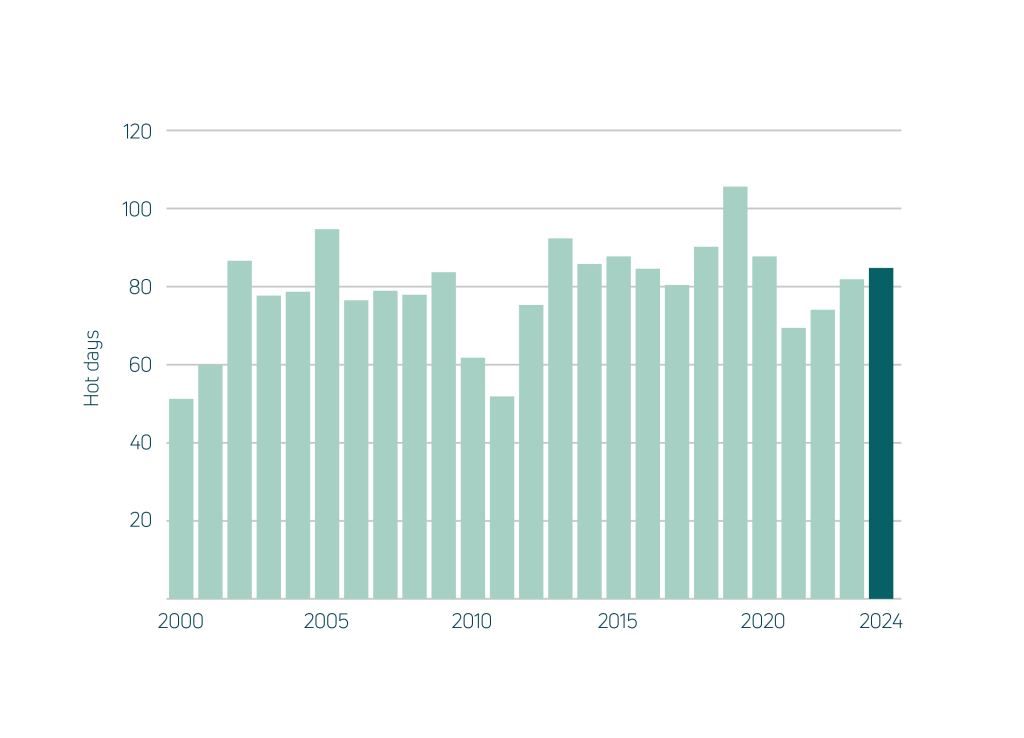
Annual average temperature across Australia was the second-highest on record after 2019, continuing an increasing trend in line with global warming. The national average temperature was 0.73 °C above the 2000–2023 average and 1.46 °C above the 1961-1990 average. The average maximum temperature in 2024 was 42.3 °C, 0.62 °C higher than the previous year and 0.4 °C above the 2000–2023 average. Maximum temperatures were close to average across eastern Australia, but the highest on record along the WA coast. The number of days exceeding 35 °C was 3.6% greater than the previous year.
Nationally, there were on average 85 hot days: 7.2% or 5.7 days more than the 2000–2023 average. Nights were cooler than the previous year. The national average was 0.60 °C below the 2000–2023 average. The average number of nights with frost was 5.1% more than the previous year and close (+2%) to the 2000–2023 average. Snow cover was 14% less than in 2023 and the lowest since 2018. Total snow occurrence was 47% below the 2000–2023 average.
Where does this data come from?
Measures of the condition of natural resources and ecosystems were derived from several spatial data sources.
Weather data was derived by combining station satellite and weather forecast model data.
Data on land cover, inundation, fire, soil condition and vegetation leaf area were derived by automated interpretation of satellite imagery. Biodiversity analysis was based on the DCCEEW SPRAT database and Threatened Species Index (TSX), providing measures of change in the relative abundance of Australia’s threatened and near-threatened species at national and regional levels.
The other indicators were estimated by combining the weather and satellite data in ANU’s environmental data assimilation system, OzWALD.
For further details on data and methods or to download the data, read more.