
 Summary Indicators
Key points
- Australia’s environmental condition remained strong for the fourth consecutive year, with a National Environmental Condition Score of 7.7.
- Most states improved, except South Australia, Victoria and Tasmania.
Environmental Condition Score (ECS)
The National Environmental Condition Score (ECS) rose by 0.6 points out of ten to reach 7.7 points, completing the first sequence of four above-average years since records started in 2000.
ECS scores increased from 2023 in most states and territories, except South Australia, Victoria and Tasmania.
The greatest declines were in South Australia, from 6.7 to 3.8, and in Victoria, from 8.8 to 6.1. The greatest increase was in NSW, from 5.8 to 7.0. Conditions in WA improved from just below average to just above average.

What is the Environmental Condition Score?
The Environmental Condition Score (ECS) is a score between 0 and 10 expressing condition relative to previous years.

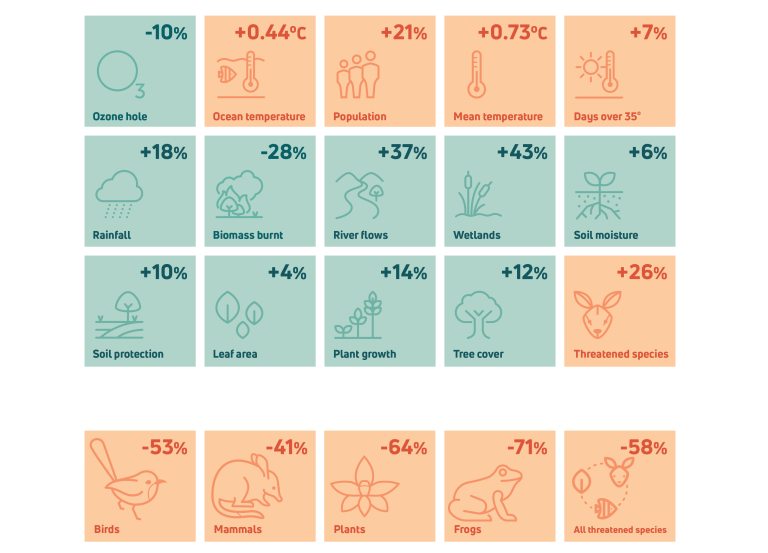
National Environment Indicators
Numbers represent the relative change from 2000–2023 average conditions. Such a change can be part of a longterm trend or be within normal variability.
Details on each of the indicators shown are provided in this report.
Where does this data come from?
Measures of the condition of natural resources and ecosystems were derived from several spatial data sources.
Weather data was derived by combining station satellite and weather forecast model data.
Data on land cover, inundation, fire, soil condition and vegetation leaf area were derived by automated interpretation of satellite imagery. Biodiversity analysis was based on the DCCEEW SPRAT database and Threatened Species Index (TSX), providing measures of change in the relative abundance of Australia’s threatened and near-threatened species at national and regional levels.
The other indicators were estimated by combining the weather and satellite data in ANU’s environmental data assimilation system, OzWALD.
For further details on data and methods or to download the data, read more.