
 Soils
Soils
Key points
- Soil conditions were stable or improved across most of Australia.
- Soil moisture conditions were poor in cropping regions along the southern coast.
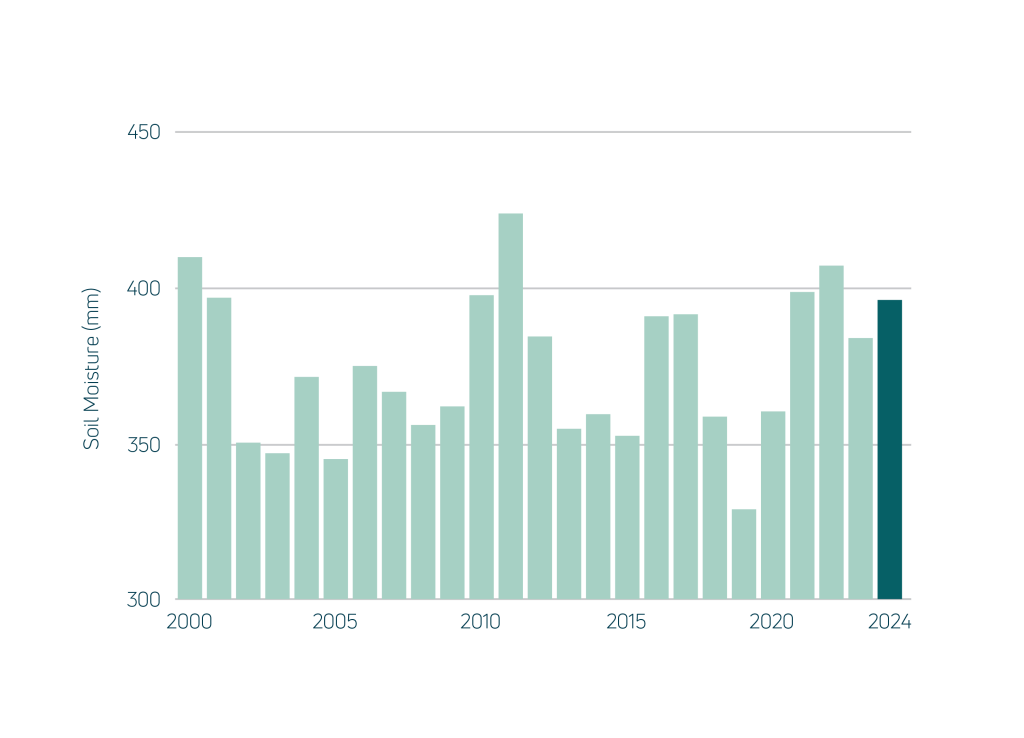
At the national scale, average moisture availability in the top 6 m of soil slightly declined by 11 mm or 3% compared to 2023, remaining similar to values experienced in the three years before and 6% above the 2000–2023 average.
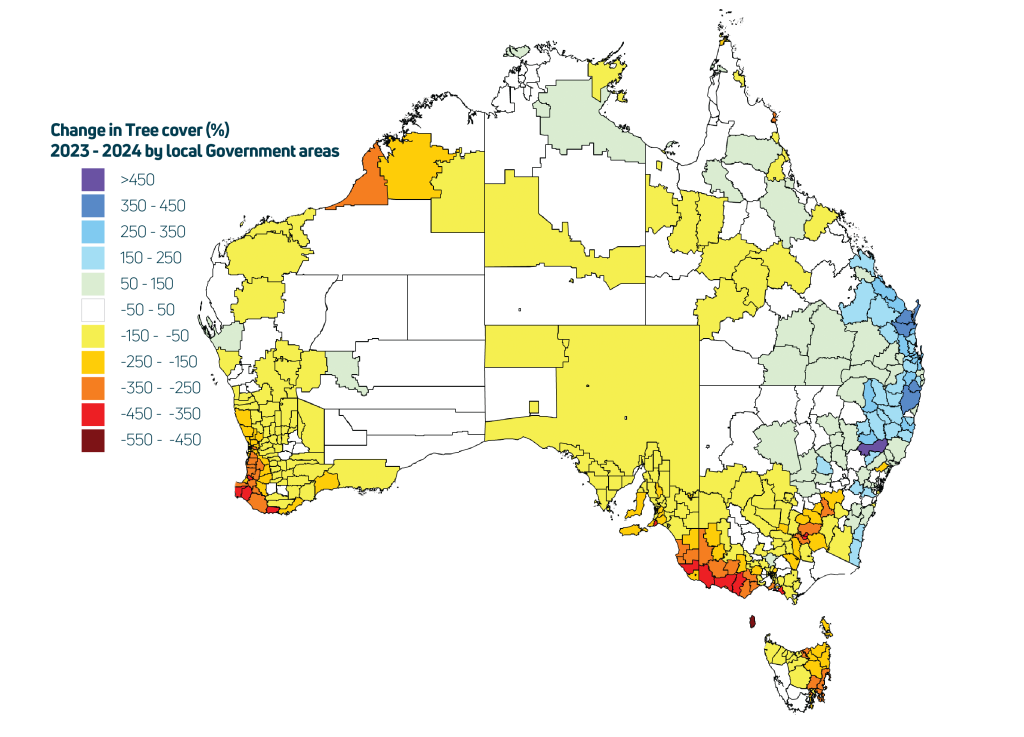
Soil moisture remained near or above average across most of Australia.
Soil water availability declined in western WA and in many of the cropping regions of southwest WA, southern South Australia, western Victoria, and parts of the Riverina and of Tasmania.
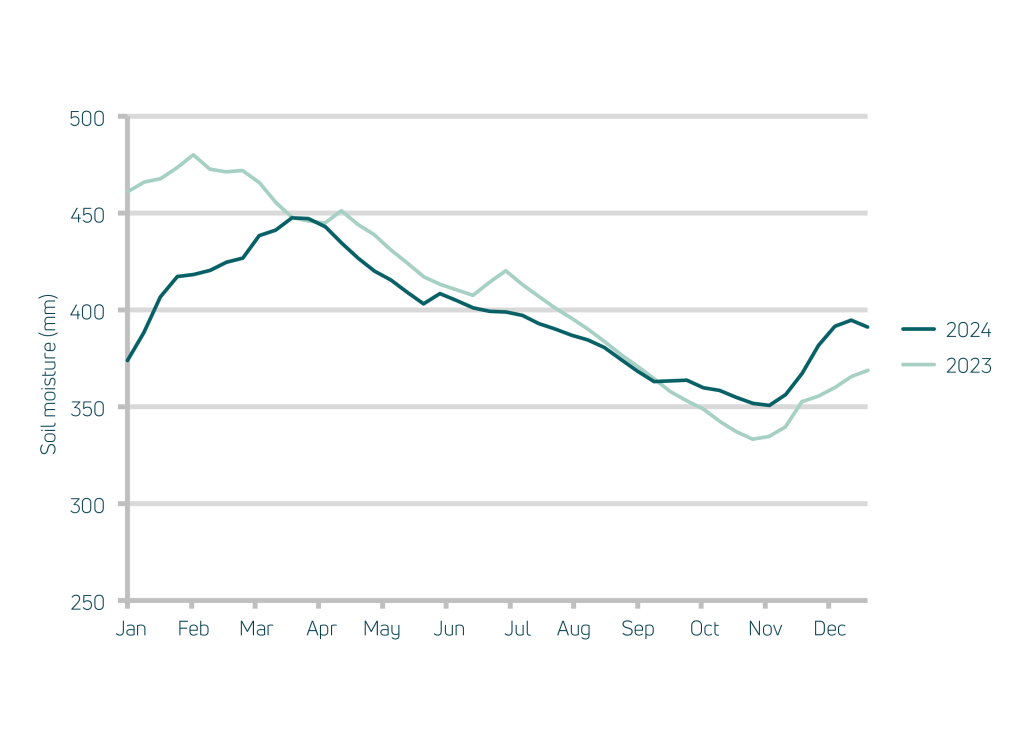
Nationally, soil moisture increased during the first months of 2024, then declined steadily until November, when it increased before stabilising later in December. Similar developments occurred across most states and territories except NSW, Victoria and Tasmania. In NSW and Victoria soil moisture declined until April before increasing until the middle of the year, when it declined again. In Tasmania, soil moisture reached its lowest value in March and increased until September before declining somewhat again.
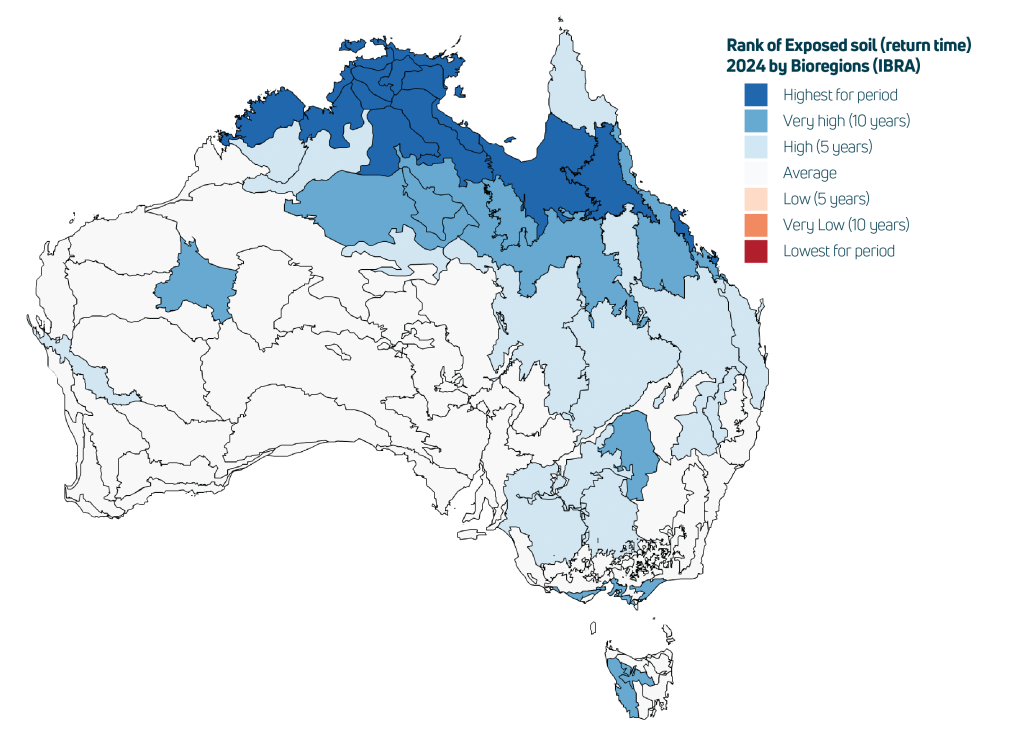
National average soil protection by vegetation and leaf litter remained stable after improving between 2020 and 2023 and was the best since 2016. Soil protection improved by 0.3% compared to the previous year and was 10% better than the 2000–2023 average.
Near – or above – average soil surface protection was observed in all Australian bioregions. The best conditions since at least 2000 were measured in most of Northern Australia.
Where does this data come from?
Measures of the condition of natural resources and ecosystems were derived from several spatial data sources.
Weather data was derived by combining station satellite and weather forecast model data.
Data on land cover, inundation, fire, soil condition and vegetation leaf area were derived by automated interpretation of satellite imagery. Biodiversity analysis was based on the DCCEEW SPRAT database and Threatened Species Index (TSX), providing measures of change in the relative abundance of Australia’s threatened and near-threatened species at national and regional levels.
The other indicators were estimated by combining the weather and satellite data in ANU’s environmental data assimilation system, OzWALD.
For further details on data and methods or to download the data, read more.