
 Vegetation
Key points
- Vegetation conditions and tree cover remained above average for the fourth year in a row, but conditions deteriorated in southern Australia.
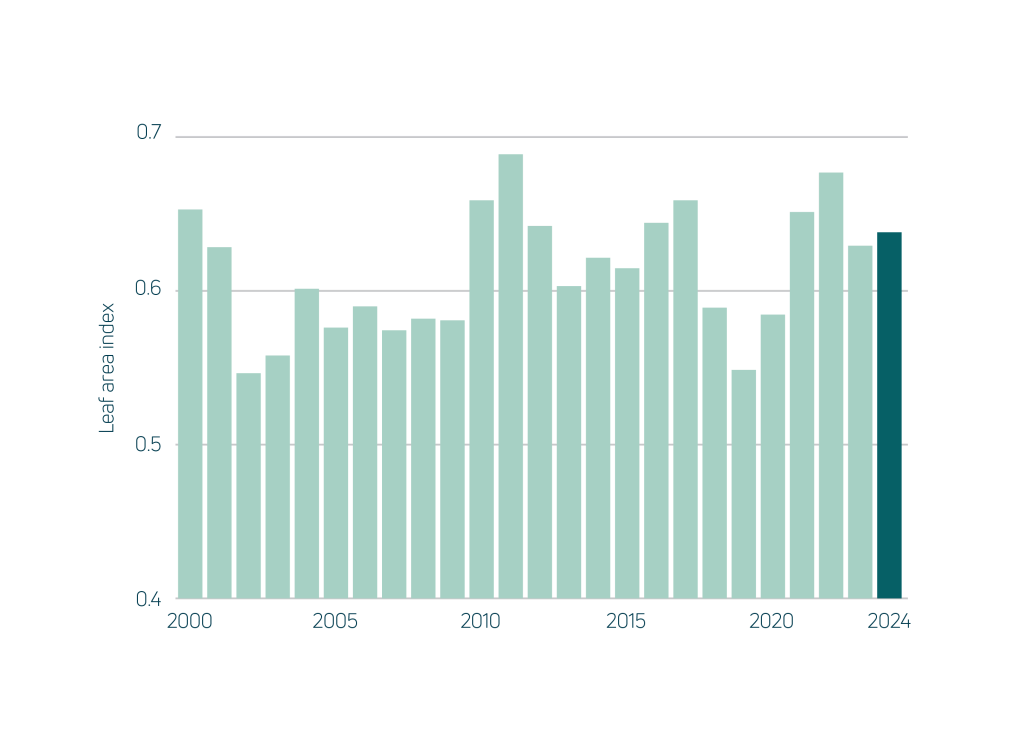
National vegetation condition improved slightly by 1% compared to the previous year and remained above the 2000–2023 average for the fourth year in a row, by 4%.
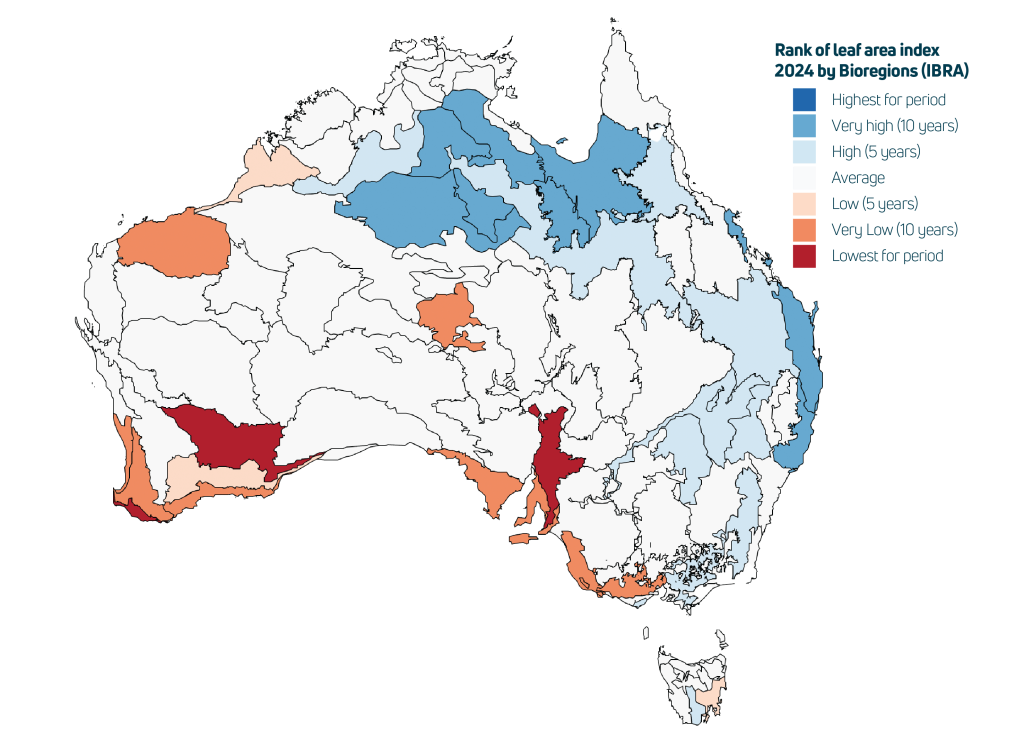
Vegetation condition remained near or above average in northern and eastern Australia, offsetting declines in the west and south of the country.
Vegetation growth rates are estimated from a combination of weather and satellite data. National growth rates were above the 2000–2023 average for the fourth year in a row.
Nationally, growth was estimated to be 5% better than the previous year and 14% above the 2000–2023 average.
Growing conditions were near or above average across most of the country except for western and southwest WA and southern South Australia, where some regions experienced the worst growing conditions since at least 2000. On the other hand, the highest growth rates in 25 years occurred in parts of northern Australia, the Central East Coast and East of Melbourne, Victoria.
Vegetation primary production was above average in all land use sectors. Growth conditions were mostly above average on grazing land (18% above 2000–2023 average conditions), natural vegetation (+13%), irrigated crops (+12%) and intensive agricultural, industrial and urban land uses (+11%). National growing conditions were closer to average in planted and native production forests (+3%) and dryland cropping (+8%).
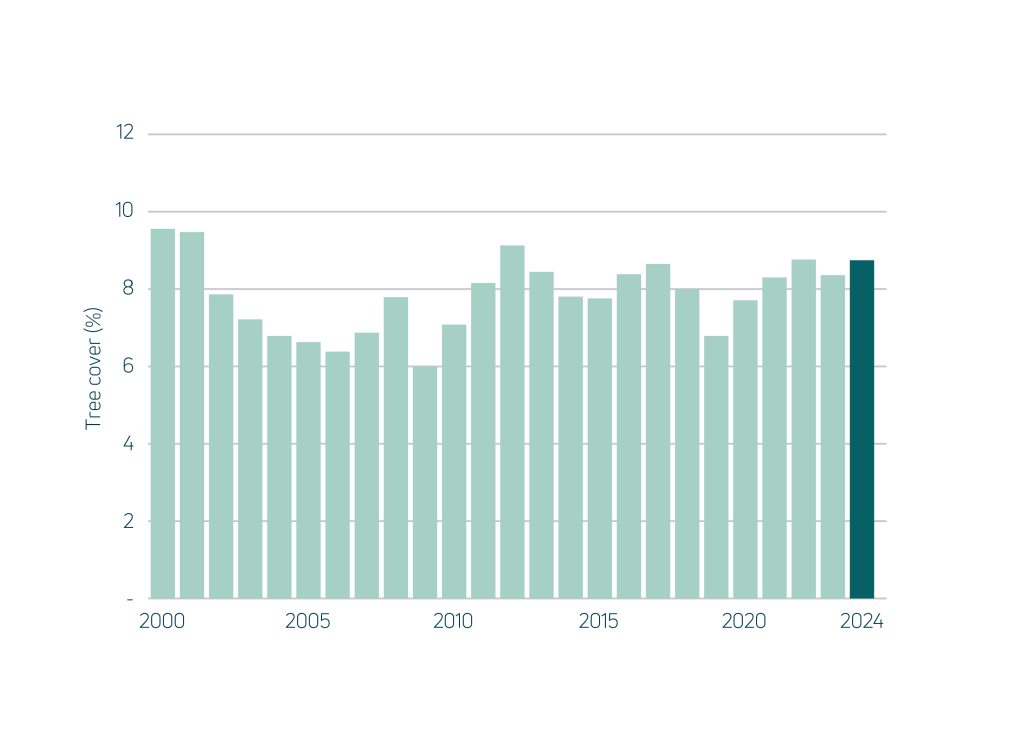
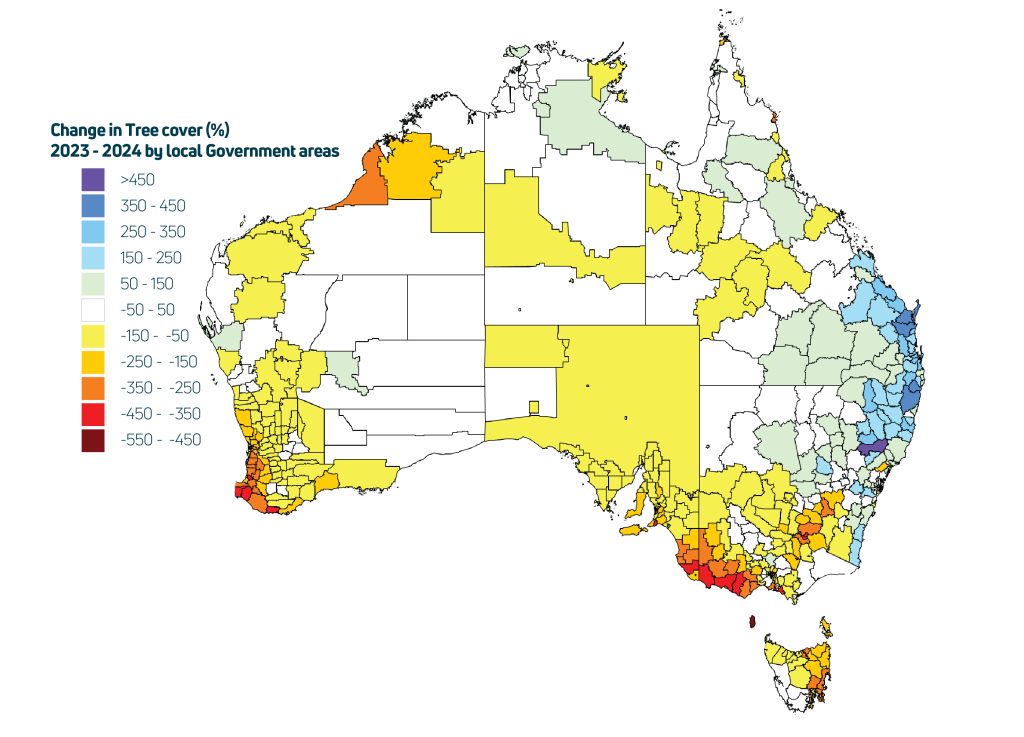
Tree cover, the canopy fraction of vegetation >2 m tall, increased by 5% or 3.3 Mha from the previous year and was 12% above the 2000–2023 average, remaining above the average for the fourth year in a row.
Tree canopy cover can decline in response to natural factors such as low water availability, pest outbreaks and bushfires or because of human actions such as forest harvesting, thinning or clearing for agriculture or residential development. Left undisturbed, tree cover typically increases in subsequent years. Tree canopy cover declined across most of inland Australia, with stronger declines in southwest WA, the Kimberley, southern SA and NSW and southwest Victoria.
Tree cover increased in northern NSW and southeast Queensland. Most of these changes can be attributed to changes in water availability. Overall, the net 3.4 Mha increase in woody canopy cover was mostly on native pasture (+2.6 Mha) and in natural environments (+0.6 Mha) with cover declining slightly on modified pasture (-0.2 Mha) and remaining largely unchanged in other land uses.
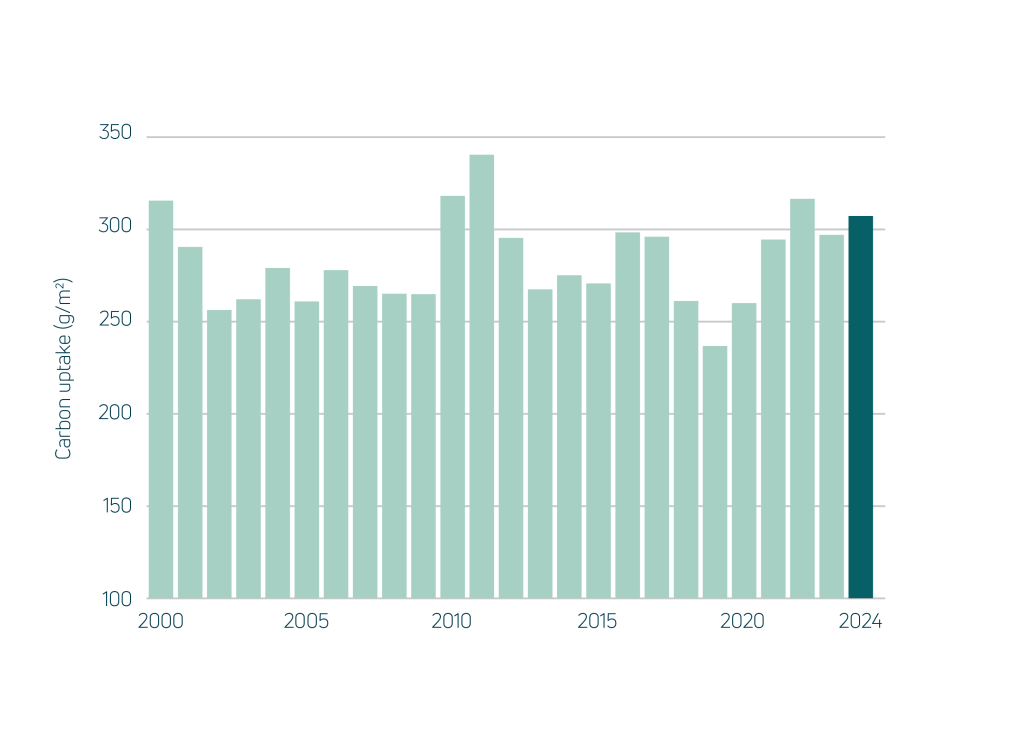
According to Government statistics, new forests exceeded forest removals, resulting in a net uptake of 88 Mt CO2 equivalents, identical to the preceding two years. This number is theoretical and only accounts for a small part of the landscape carbon balance. A more comprehensive estimate includes fire emissions of 362 Mt CO2 equivalents, and net carbon uptake (vegetation carbon uptake minus natural emissions) of 3,242 Mt CO2 equivalents in 2024. The resulting balance was a net uptake of 2,342 Mt CO2 equivalents (excluding some smaller natural non-CO2 gains and losses). This is 33% higher than the previous year, 82% higher than the 2000–2023 average, and above average for the fourth year in a row. This strong gain reflects Australia’s natural ‘boom-bust’ cycles, with ongoing favourable growing conditions and low fire activity across most of the country, especially in Northern Australia.
Where does this data come from?
Measures of the condition of natural resources and ecosystems were derived from several spatial data sources.
Weather data was derived by combining station satellite and weather forecast model data.
Data on land cover, inundation, fire, soil condition and vegetation leaf area were derived by automated interpretation of satellite imagery. Biodiversity analysis was based on the DCCEEW SPRAT database and Threatened Species Index (TSX), providing measures of change in the relative abundance of Australia’s threatened and near-threatened species at national and regional levels.
The other indicators were estimated by combining the weather and satellite data in ANU’s environmental data assimilation system, OzWALD.
For further details on data and methods or to download the data, read more.