
 Fire
Fire
Key points
- Fire activity was relatively low, despite high bushfire activity in western Victoria.
Australia experienced relatively few major bushfires in 2024. On 13 February, strong winds and high temperatures created catastrophic fire danger in the Wimmera in Western Victoria and extreme fire danger across the state. Dry lightning ignited several fires, including a major one in the Grampians in Western Victoria. The fires burnt over 6,600 ha, destroyed 44 houses and injured 5 firefighters.
Between 21 and 23 February, extreme heat and strong winds spread fire danger across South Australia, Victoria, Tasmania, and New South Wales. Fires ignited near Beaufort in Western Victoria, burning 14,027 ha, and near Dee in the central Tasmanian highlands, burning over 10,000 ha. Western Australia saw multiple heatwaves, with temperatures reaching 49.9 °C, leading to extreme fire danger and a major fire near Balladonia in arid southern WA.
At the start of the 2024/25 fire season on 16 November, a cold front increased fire danger across South Australia and Victoria, igniting multiple fires, including one near Ballarat in Western Victoria. In December, hot and windy conditions led to extreme fire danger. On 16 December, dry lightning started a major fire in Grampians National Park, which burned 76,000 hectares and lasted for weeks. By 26 December, worsening conditions prompted evacuations. Fire danger peaked on 4 and 5 January before cooler weather on 6 January helped contain the blaze.
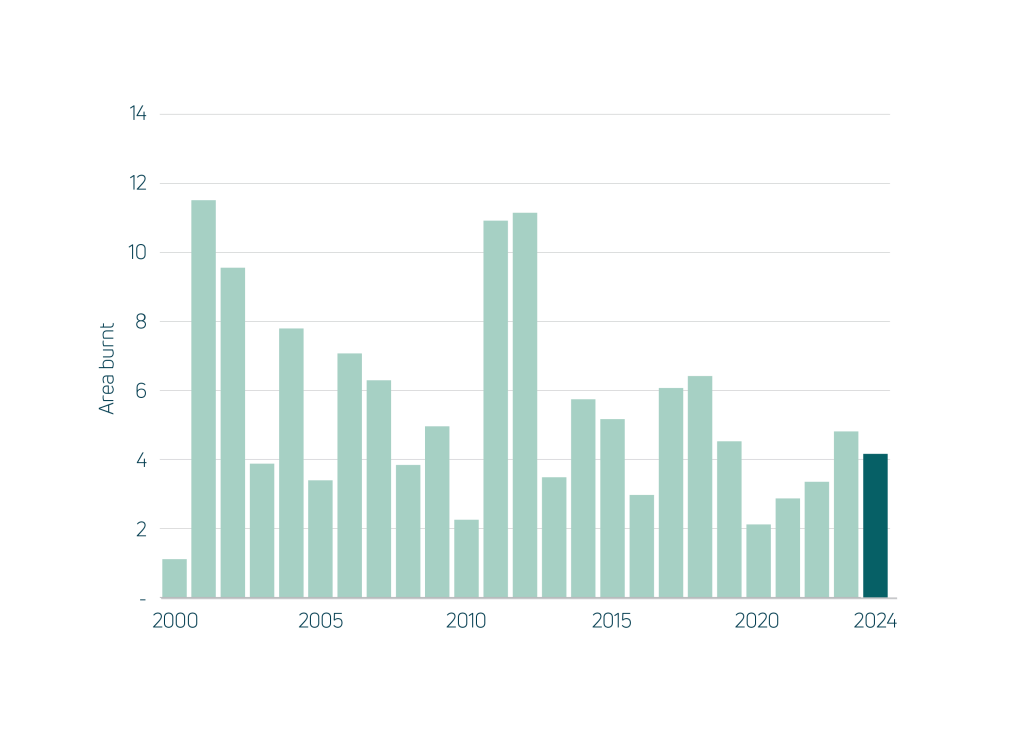
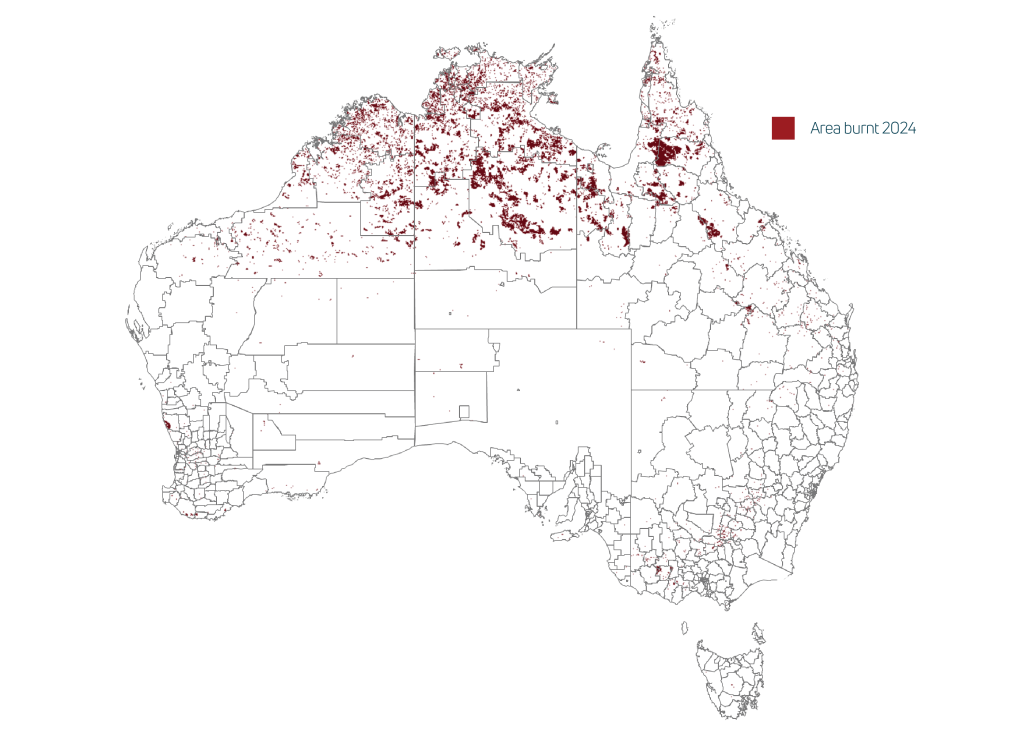
Nationally, the area burnt was greater than the previous year but remained below average for the sixth year in a row. The total area burnt was 34 Mha, 13% more than the previous year but 23% below the 2000–2023 average. Fire activity was near average across most of Australia, but high in western Victoria and above average in the Riverina region and western Queensland.
Fire activity was relatively low in inland and northern WA, Cape York and northern NSW. Remotely sensed fuel moisture content provides a measure of landscape flammability. Nationally, the minimum value observed during the year was similar to the previous year (+1%) and the 2000–2023 average (+2%), indicating relatively unfavourable conditions for bushfires.
Regionally, the lowest fuel moisture conditions since at least 2000 were observed in parts of inland and northwest WA and southern Tasmania, while drier- than-average fuel was also observed along the coast of SA and in western Victoria Total fire carbon emissions were below average at 103 Mt carbon. Fire emissions were 54% lower than in 2023 and 28% below the 2000–2023 average. As in other years, savanna fires in northern Australia were responsible for most fire emissions.
Where does this data come from?
Measures of the condition of natural resources and ecosystems were derived from several spatial data sources.
Weather data was derived by combining station satellite and weather forecast model data.
Data on land cover, inundation, fire, soil condition and vegetation leaf area were derived by automated interpretation of satellite imagery. Biodiversity analysis was based on the DCCEEW SPRAT database and Threatened Species Index (TSX), providing measures of change in the relative abundance of Australia’s threatened and near-threatened species at national and regional levels.
The other indicators were estimated by combining the weather and satellite data in ANU’s environmental data assimilation system, OzWALD.
For further details on data and methods or to download the data, read more.