
 Oceans
Key points
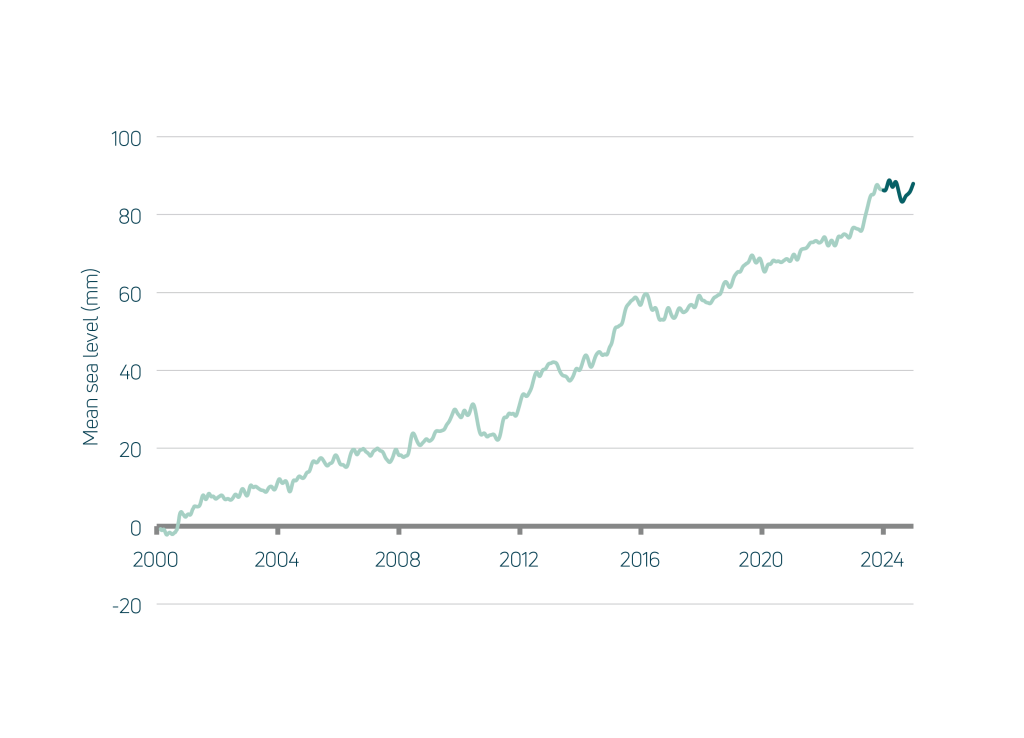
- Global sea level rose slower than in the previous year.
- Sea surface temperatures increased globally and Australia broke new records.
- The Great Barrier Reef experienced the fifth bleaching event since 2016.
Oceans absorb 93% of excess heat from climate change. Global ocean heat content increased by 3.6% compared to the previous year, continuing a decades-long rise. The global mean sea level at the end of 2024 was 1.6 mm higher than a year earlier. Sea level has increased by 88 mm since 2000 and 108 mm since 1993.
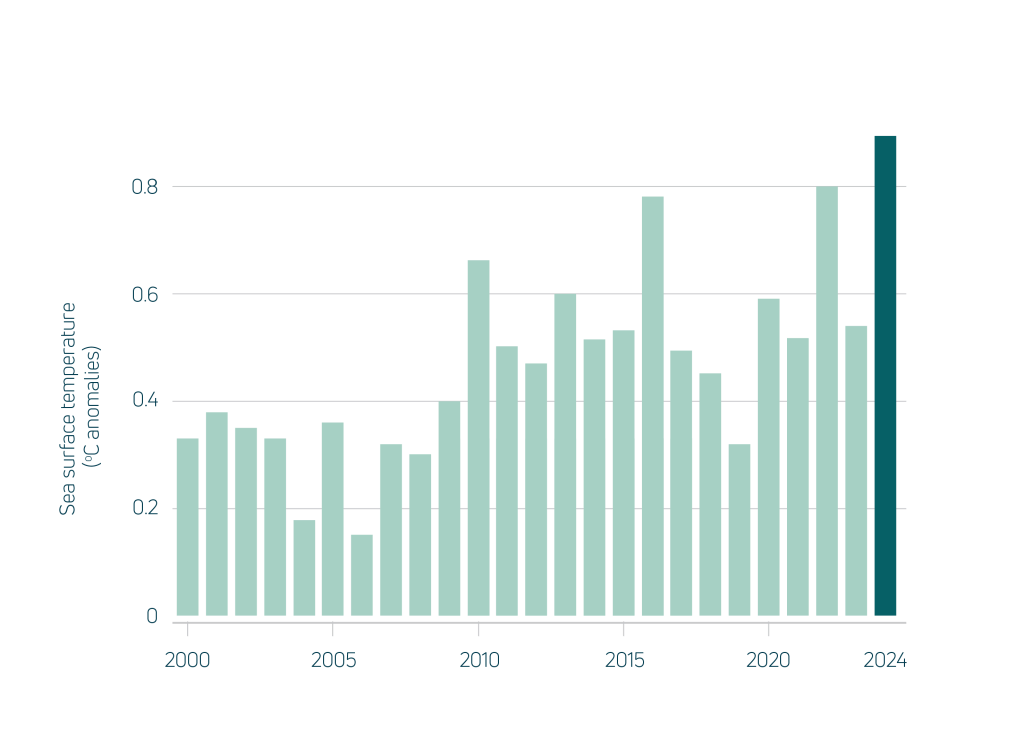
Mean sea surface temperature in 2024 was the highest on record, both globally and around Australia: +0.79 °C globally and +0.89 °C in the Australian region relative to 1961–1990. Ocean warming has risen steadily since ~1970, bringing widespread marine heat stress.
The Great Barrier Reef (GBR) saw above-average sea temperatures. After tropical cyclone Jasper in December 2023, the central GBR was again affected by cyclone Kirrily in January 2024. Temperatures peaked in March, triggering the fifth mass coral bleaching event since 2016. Crown-of-thorns starfish outbreaks persisted on some southern reefs. Although hard coral cover increased across the reef, most surveys were conducted before the full impacts of bleaching and cyclones were clear.
In December 2024, a marine heatwave reached Ningaloo Reef in Western Australia, initiating a bleaching event there.
Where does this data come from?
Measures of the condition of natural resources and ecosystems were derived from several spatial data sources.
Weather data was derived by combining station satellite and weather forecast model data.
Data on land cover, inundation, fire, soil condition and vegetation leaf area were derived by automated interpretation of satellite imagery. Biodiversity analysis was based on the DCCEEW SPRAT database and Threatened Species Index (TSX), providing measures of change in the relative abundance of Australia’s threatened and near-threatened species at national and regional levels.
The other indicators were estimated by combining the weather and satellite data in ANU’s environmental data assimilation system, OzWALD.
For further details on data and methods or to download the data, read more.